Ravi Pathak
This is dedicated for the stock market investment ideas. I want to share what I have learned and what I am trading and how it is performing with anybody and everybody. I have failed a lot with technical analysis, so there is no guarantee of profits.Nice thing is My success(profits) still outweighs my losses due to sound money management.The purpose here is strictly educational.

3 comments:
Ravi,
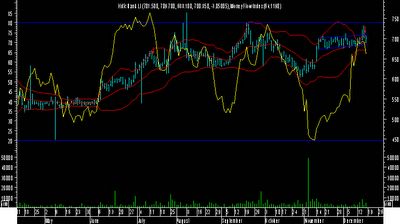
Could you please explain what is meant by bolinger bands and money flow index.
reg
Joydeep
Hallo,
Can you tell me its hdfc or hdfc bank ???
it looks like hdfc bank.
Mahendra mudaliar
Hallo,
Can you tell me its hdfc or hdfc bank ???
it looks like hdfc bank.
Mahendra mudaliar
Post a Comment