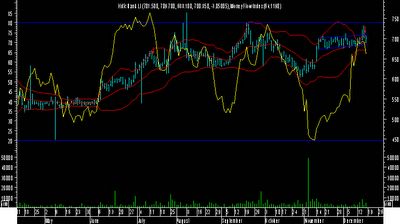
Daily chart of HDFC suggest following 1.There exist tremendous narrow range of trading activity in HDFC Bank.Bollinger bands are narrower by 50% then normal.Money flow index also shows peeking. Technically stock looks weaker and one should short with the target of around 620 with the stop at 734.
 Ravi Pathak

3 comments:
Ravi,
Could you please explain what is meant by bolinger bands and money flow index.
reg
Joydeep
Hallo,
Can you tell me its hdfc or hdfc bank ???
it looks like hdfc bank.
Mahendra mudaliar
Hallo,
Can you tell me its hdfc or hdfc bank ???
it looks like hdfc bank.
Mahendra mudaliar
Post a Comment